Formating a data file and upcoming project about the UFC
I have finally decided to give a go at Tableau recently completed the first part of a course on Udemy: Tableau 2020 A-Z: Hands-On Tableau Training for Data Science. Before starting the second part, Tableau 20 Advanced Training: Master Tableau in Data Science, I wanted to play with some new data and apply what I have learned. Since I am a big combat sports enthusiast, I decided to focus this project on the Ultimate Fighting Championship (UFC).
I recently came across different datasets with a lot of relevant stats for all the fights that have happened in the UFC. The data were obtained using a web scraper, more precisely a Scrapy spider crawling ufcstats.com. I wish I was the one that wrote that scraper but all credits due to fanghuiz. As stated in the readme of the repository, note that the current version of the scraper will crawl the entire website, so it might take some time. For those who wish to get the data but not to run the different spiders, feel free to download them from my repository. Check the file ufcFightStats_formatted.csv and ufcFightInfos.csv. Now allow me to run you through some details:
In fanghuiz’s repository, there are 3 spiders:
ufcFightsufcFightersupcoming
The ufcFights spider returns fight’s data and store them in a .csv file and a .jl (newline-delimited JSON) file: ufcFightInfos.csv and 2021-02-11T00-34-21.jl. The .csv ccontains the fight’s metadata: event data, event location, the matchup for a fight, fighters’ name, winner, etc. The .jl contains stats for every fights: significant strikes attempted, significant strikes landed, takedown, etc.
The ufcFighters spider returns fighter’s career stats and stores them in a .csv file: reach, height, current weight class, stance, significant strikes landed per minute, etc.
The upcoming spider returns matchup metadata for an upcoming event: date, fight’s id, red corner’s name, red corner’s id, blue corner’s name, blue corner’s id, location, and weight class.
The first spider is more interesting than the rest for me. Yet, if exploring the file with the fight’s metadata with Tableau went fine, I can’t say the same with the .jl one. Tableau does not read .jl files. So I first thought of simply converting it to a readable format like CSV with pandas.DataFrame.to_csv:
import pandas as pd
import json
import requests

with open('2021-02-11T00-34-21.jl') as f:
    lines = f.read().splitlines()

df_inter = pd.DataFrame(lines)
df_inter.columns = ['json_element']
df_inter['json_element'].apply(json.loads)
df_final = pd.json_normalize(df_inter['json_element'].apply(json.loads))
df_final.to_csv('ufcFights.csv',index=False)
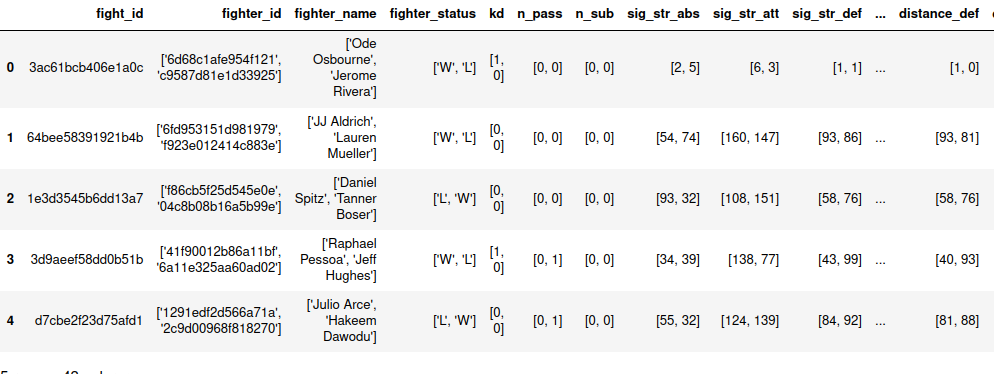
However, I didn’t take into account the content of the cells. If you look at the screenshots above you can see that all of the cells, except fight_id, contain a list of 2 elements. For instance, the fighter_name cell’s value for the first row is ['Ode Osbourne','Jerome Rivera']. What I would like to have is one element per cell. We would want to split a row with information about fighter 1 and fighter 2 into 2. The only element they would have in common would then be fight_id. Fortunately, pandas has a method called pandas.DataFrame.explode that transforms each element of a list-like to a row. Using this method, I was able to format my table into something more of my liking:
import pandas as pd
import json
import requests
import numpy as np
from ast import literal_eval

def format_dataframe(df,terms):
    for term in terms:
        df[term] = df[term].apply(literal_eval)
    return df

terms = {'fighter_id','fighter_name','fighter_status','kd','n_pass',
         'n_sub','sig_str_abs','sig_str_att','sig_str_def','sig_str_land',
         'total_str_abs','total_str_att','total_str_def','total_str_land','td_abs',
         'td_att','td_def','td_land','head_abs','head_att',
         'head_def','head_land','body_abs','body_att','body_def',
         'body_land','leg_abs','leg_att','leg_def','leg_land',
         'distance_abs','distance_att','distance_def','distance_land','clinch_abs',
         'clinch_att','clinch_def','clinch_land','ground_abs','ground_att',
         'ground_def','ground_land'}
df = pd.read_csv('ufcFights.csv')
df = df.dropna() #Let's get rid of the fights with no stats
df = format_dataframe(df,terms)
df = df.apply(lambda x: x.explode() if x.name in terms else x)
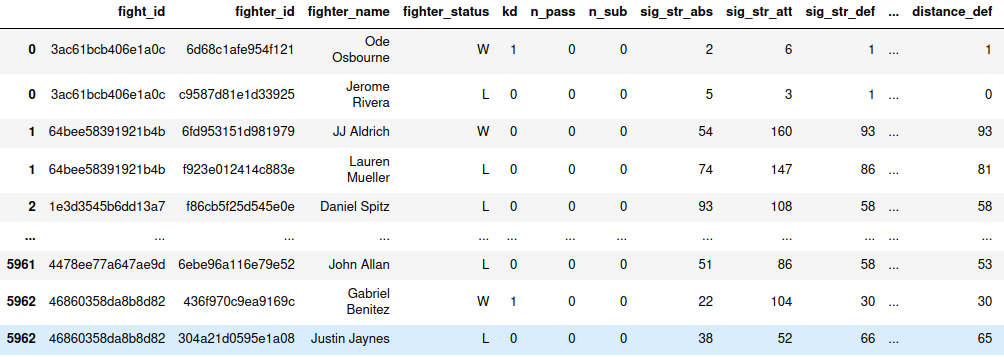
Now, it is much easier to navigate through the file with Tableau. For instance, it was really easy to obtain this plot.
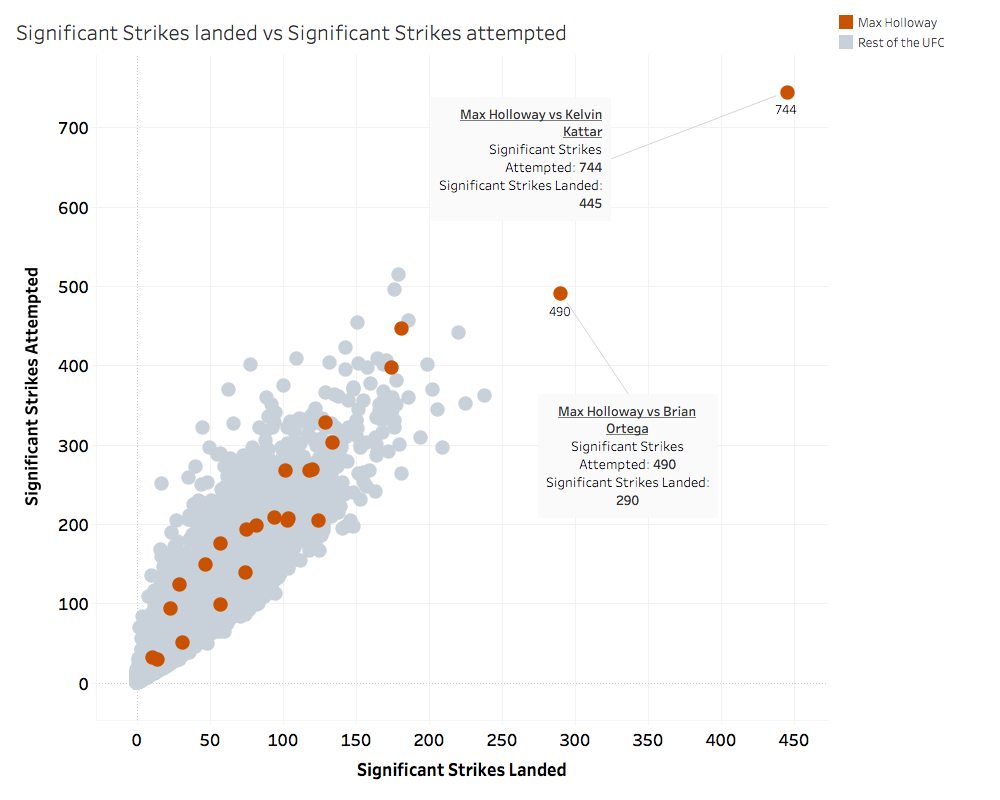
This scatterplot shows numbers of significant strikes attempted vs significant strikes landed for every fighter. Different versions of this plot were shared on social media after an incredible performance of my favourite fighter Max “Blessed” Holloway. In his most recent fight against Kelvin Kattar, he landed 445 significant strikes out of 744 over five rounds! That is a crazy number and because of it, Max Holloway can be spotted straight away on the plot: he is an outlier! This fight and the one against Brian Ortega set him apart from the rest of the UFC!
What started as a quick way to play around with Tableau turned into a much more fun project. I am looking forwards to exploring more of these UFC’s data!